Coinbase: Will the crypto market bottom in the middle and late stages of Q2 2025?

Reprinted from jinse
04/16/2025·3DSource: [Coinbase](https://www.coinbase.com/zh-cn/institutional/research- insights/research/monthly-outlook/monthly-outlook-apr-2025) ; Translated by: AIMan@Golden Finance
Key points:
-
As of mid-April, the total market value of cryptocurrencies (excluding BTC) has dropped 41% to $950 billion from its $1.6 trillion high in December 2024, while VC investment has dropped 50-60% from its 2021-22 level.
-
We think this is worth a defensive stance on risk for the moment, but we believe that cryptocurrency prices may bottom out in the mid-to-late 2025 Q2, laying the foundation for better performance in Q3 2025.
Overview
Due to the global imposition of tariffs and the possibility of further escalation, some convergence signals may herald a new round of "cryptocurrency winter" is coming. The total market value of cryptocurrencies (excluding Bitcoin) is currently at $950 billion, a sharp drop of 41% from the high of $1.6 trillion in December 2024 and 17% from the same period last year. From another perspective, it is even lower than the market cap for almost the entire period from August 2021 to April 2022.
At the same time, VC investment in the cryptocurrency sector in Q1 2025 rebounded compared with the previous quarter, but it still fell by 50%-60% from the peak level of the 2021-22 cycle. This severely limits new capital to enter the ecosystem, especially in the altcoin space. All of these structural pressures stem from uncertainty in the macro environment, and traditional risky assets continue to face resistance from fiscal tightening and tariff policies, resulting in paralysis of investment decisions. As the stock market is struggling, the road to recovery of cryptocurrencies remains challenging even as the regulatory environment brings special benefits.
These factors interact to paint a difficult cyclical outlook for the digital asset field, and caution may still be needed in the short term (perhaps in the next 4-6 weeks) . However, we also believe that investors need to adopt strategic strategies to deal with the market, as we expect this may happen fairly quickly when market sentiment finally recovers, and we remain optimistic about the second half of 2025.
Bull and bear markets
A common indicator that defines a bull and bear market in the stock market is that stock prices fall by 20% or more from recent lows or highs, respectively. This number is a bit arbitrary and obviously doesn't quite apply to the cryptocurrency market, which usually experiences 20% price fluctuations in a short period of time, but this does not necessarily mean a real change in the market structure. That said, historical data shows that cryptocurrencies like BTC can fall 20% in a week, but are still trading on a wider uptrend and vice versa.
Additionally, cryptocurrency trading takes place 24/7, meaning that during traditional markets are closed (such as evenings and weekends), it can often reflect a wider range of risk sentiments. This may amplify the reaction of cryptocurrency prices to external events around the world. For example, during the Fed’s (rather aggressive) rate hike cycle from January to November 2022, U.S. stocks (represented by the S&P 500) fell 22%. By contrast, the decline in Bitcoin price – arguably started earlier (November 2021) – ended up falling 76% during the same period, almost 3.5 times the stock market sell-off.
The truth in contradiction
Regarding the traditional 20% indicator of bull markets and bear markets, the first thing to note is that (at best) is just a rule of thumb and there is no universally accepted definition. Just as Supreme Court Justice Potter Stewart’s candid comment on obscene (“I know it as soon as I see it”), identifying market trends often relies on intuition and experience rather than rigid formulas.
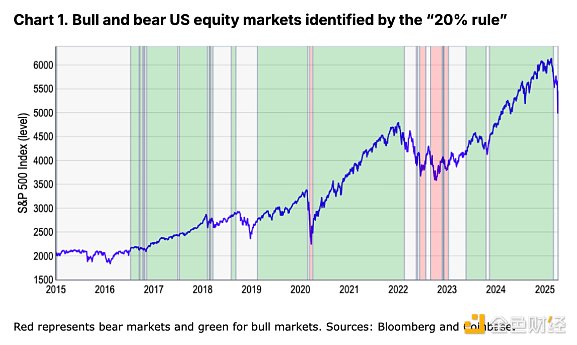
Nevertheless, to formalize this indicator, we analyzed the market highs and lows of the S&P 500 within the one-year rolling closing window to find major reversal points. Over the past decade, this indicator shows that U.S. stocks have experienced about four bulls and two bears – excluding the latest sell- offs in late March and early April (our model has recently begun signaling bear markets). See Figure 1.
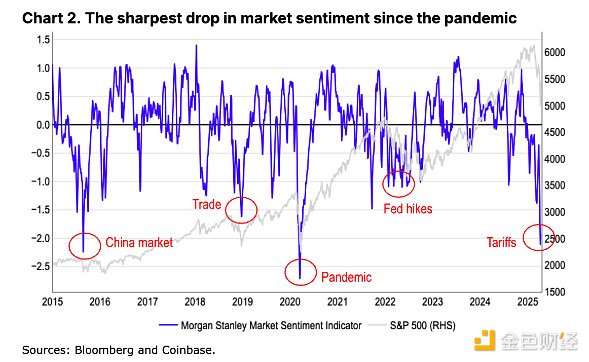
However, this indicator ignores at least two significant 10-20% declines over the past decade, which greatly impacted market sentiment, such as the surge in volatility in late 2015 (turbulence in Chinese stocks) and the surge in 2018 (global trade concerns, measured by the Federal Reserve’s measure of uncertainty in global trade policy). See Figure 2.
We have seen in the past that sentiment-driven declines often trigger defensive portfolio adjustments even if they are not met the arbitrary threshold of 20%. In other words, we believe that bear markets fundamentally represent a shift in the pattern of market structure—characterized by deterioration in fundamentals and shrinking liquidity—rather than just a percentage decline. Additionally, the “20% rule” may be complacent because it ignores early warning signals such as market depth narrowing and defensive sector rotation that often herald a major recession historically.
Alternative indicators
Therefore, we look for alternative indicators that better capture the subtle interaction between price movement and investor psychology—whether it is stocks or cryptocurrencies. A bear market is not only about actual returns, but also about market sentiment, because it often determines the sustainability of the performance decline that investors are trying to avoid. This can be a tricky concept because while we are expecting a reversal of long-term trends, these shifts do not necessarily need to be long-term ups or downs. The COVID-19 pandemic is a good example, it first had a brief and sharp fluctuation, and then a reversal. Of course, the short bear market cycle was because the subsequent fiscal and monetary policy responses adopted by authorities around the world were huge - policies that saved investors from the possible long decline.
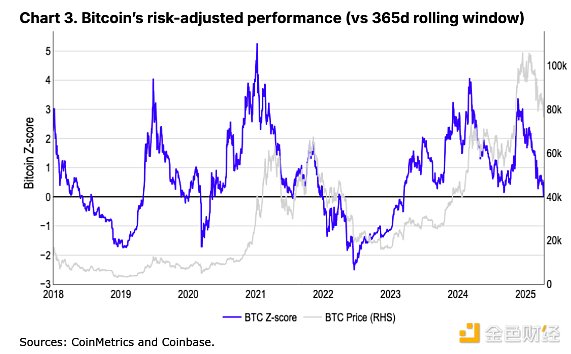
We believe that rather than relying on rules of thumb, consider the following indicators such as (1) risk-adjusted performance (measured by standard deviation) and (2) 200-day moving average (200d MA), which may provide stronger clues to the overall market trends of both types of assets. For example, we found that Bitcoin fell by 1.4 standard deviations from its average performance in the first 365 days between November 2021 and November 2022. This is equivalent to a 1.3 standard deviation decline in stocks over the same period of time, meaning Bitcoin is down 76% as measured by risk- adjusted prices, while the S&P 500 is down 22%.
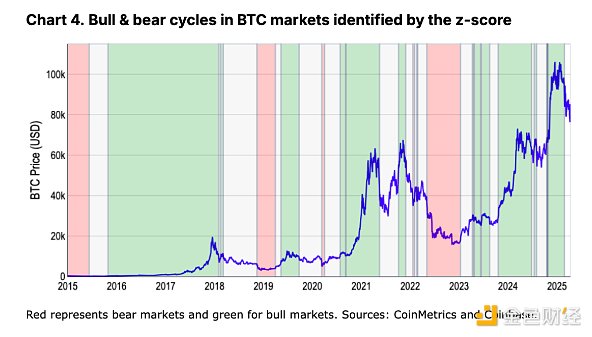
 Since this indicator naturally reflects the greater volatility of
cryptocurrencies, the z-score is particularly suitable for cryptocurrency
markets, although it is not without its drawbacks. Not only is it more
difficult to calculate, but in a stable market, the indicator often produces
fewer signals and may not respond quickly enough to changes in the overall
trend. For example, our model shows that the recent bull market cycle ended at
the end of February. But since then, the model classifies all subsequent
activities as “neutral,” highlighting its potential lag in the rapidly
changing market dynamics.
Since this indicator naturally reflects the greater volatility of
cryptocurrencies, the z-score is particularly suitable for cryptocurrency
markets, although it is not without its drawbacks. Not only is it more
difficult to calculate, but in a stable market, the indicator often produces
fewer signals and may not respond quickly enough to changes in the overall
trend. For example, our model shows that the recent bull market cycle ended at
the end of February. But since then, the model classifies all subsequent
activities as “neutral,” highlighting its potential lag in the rapidly
changing market dynamics.
In contrast, we believe that the 200-day moving average (200DMA) provides a simpler and more robust framework for identifying ongoing market trends. Since it takes at least 200 days of data to perform efficient calculations, it can smooth out short-term noise and adapt to recent price trends, thus showing market momentum more clearly. The "rules" are simple:
-
The bull market is characterized by the continued price trading above 200DMA and maintaining the upward momentum, while
-
The bear market is characterized by trading continues to fall below 200DMA, while accompanying the downward momentum.
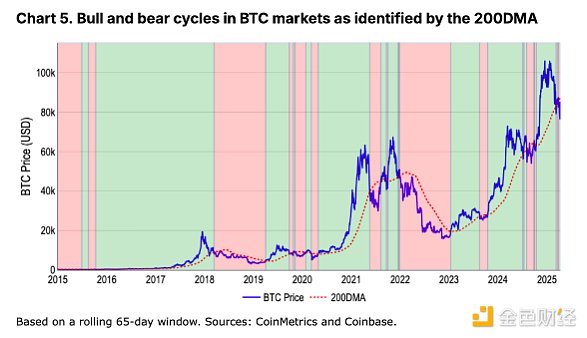
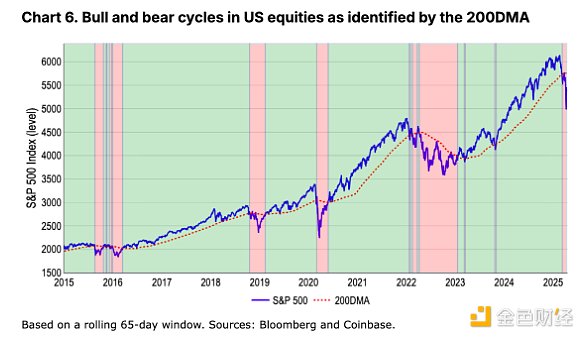
We believe that this approach not only aligns with the broader trend signals in the “20% rule” and z-score models, but also improves the accuracy required to obtain actionable insights under dynamic market conditions. For example, in addition to capturing the sell-offs during the pandemic (early 2020) and the Fed rate hike cycle (2022-23), it also captures the cryptocurrency cold winter in 2018-19 and the market decline in mid-2021 due to China's ban on cryptocurrency mining. In addition, we found that it better reflects the large fluctuations in investor sentiment during different periods. See Charts 5 and 6.
Encrypted winter?
So, are we in a cryptocurrency bear market? So far, we have focused primarily on Bitcoin analysis, as comparing with traditional markets such as U.S. stocks requires that the asset has a sufficient history. However, while Bitcoin is often used as an indicator to measure the overall performance of cryptocurrencies, it has become increasingly impractical as the asset class expands into new areas (e.g. memecoin, DeFi, DePIN, AI proxy, etc.).
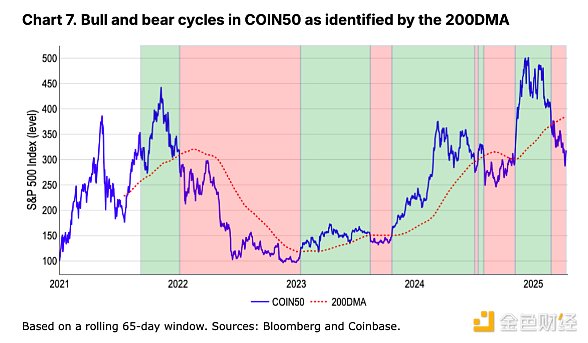
For example, Bitcoin’s 200-day moving average model does show that the token’s recent sharp decline is enough to form a bear market cycle that began in late March. But the same analysis of the COIN50 index (covering the top 50 tokens in market cap) shows that the asset class has been in the bear market overall since the end of February. In fact, this is consistent with the situation where the total market capitalization of cryptocurrencies (excluding BTC) fell 41% to $950 billion from its December 2024 high, while Bitcoin fell (less than 20% over the same period. This difference highlights the higher volatility and risk premium inherent in altcoins below the risk curve.
in conclusion
As Bitcoin’s role as a “store of value” continues to grow, we believe that a comprehensive assessment of the overall market activity of cryptocurrencies is needed to better define the bull and bear markets of this asset class, especially as we may see an increasingly diversified behavior in its expanding sector. Nevertheless, both the BTC and COIN50 indexes have recently fallen below their respective 200-day moving averages, which indicates that the overall market may be on a long-term bearish trend. This is consistent with a decline in the total market capitalization of cryptocurrencies and a decrease in risky VC investment in the sector, which signs that the cryptocurrency market may enter a cold winter.
Therefore, we believe that it is necessary to take a defensive stance on risks at the moment, but we still believe that cryptocurrency prices may bottom out in the mid-to-late 2025 Q2, laying the foundation for better performance in Q3 2025. At present, the challenges of the current macro environment require us to be more cautious.

 panewslab