Glassnode: Has BTC entered a correction phase? What are the near-term prospects?

Reprinted from jinse
01/16/2025·19days agoSource: Glassnode; Compiled by: Baishui, Golden Finance
summary
-
Bitcoin has entered a correction phase, trading 11% down from its all-time high of $108,000, but remains above key support levels, maintaining a constructive market structure.
-
Z-Score analysis shows that cyclical highs typically coincide with various indicators ranging from 1.5 to 2.0σ above average, providing a framework to help navigate bullish market phases.
-
Bitcoin’s current price is approximately 10% above short-term holders’ cost basis of $884,000, highlighting the downside risks if momentum stalls and prices fall below this level.
-
Unrealized losses were concentrated among short-term holders, with 2.0-3.5 million BTC being held, reflecting moderate market stress.
-
Relative unrealized losses peaked at 4.3% in Q3 2024, significantly lower than in previous cycles driven by external shocks, highlighting a more spot-oriented and patient market.
peak of change
The realized price reflects the average price of all Bitcoins last traded on- chain and therefore represents the total cost base of the market. The MVRV ratio is the ratio between the spot price and the realized price, and it measures the size of the average unrealized profit. Values above 1 represent average unrealized profits, values below 1 represent unrealized losses.
The MVRV ratio is currently trading at 1.32, indicating that the average unit of BTC holds 32% of unrealized profits. This structure is similar to the post- ATH structure in mid-April 2024, indicating that overall sentiment remains positive despite the market correction.
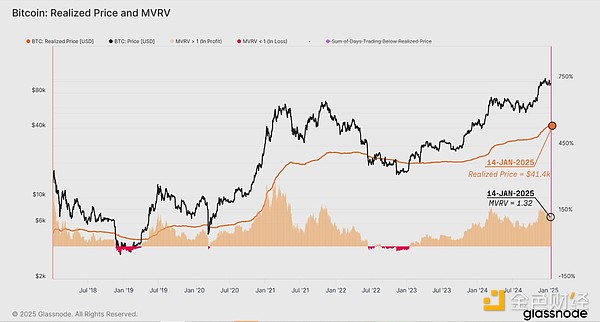
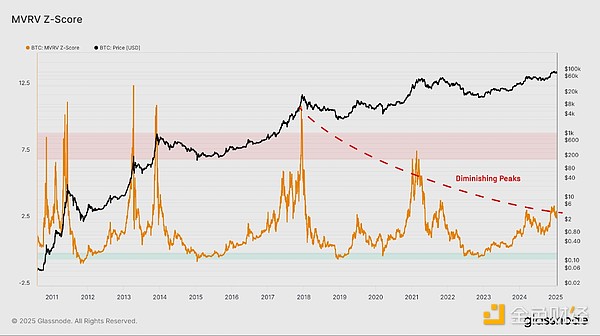
The Bitcoin market has matured over the years, and at the same time, MVRV peaks have cyclically decayed near cyclical tops. This reflects an overall weakening of speculative extremes as asset size grows.
MVRV highs are gradually lower each market cycle, indicating that the average unrealized profit multiple is decreasing:
-
2011: 8.07 times
-
2014: 6.00x
-
2018: 4.81 times
-
2021: 3.98x
-
2024: 2.78x (YTD)
This decline indicates a gradual decrease in volatility and speculative intensity as market size and liquidity grow. This also suggests that while Bitcoin remains cyclical, each spike has become relatively less exaggerated, consistent with a more mature and efficient market structure.

In order to explain the decrease in the MVRV peak value in successive cycles, we can use statistical methods to normalize its oscillation range. A widely accepted method in financial time series analysis is the Z-score, which is calculated as follows:
Z-Score = (X - μ) / σ
-
X is the observed value,
-
μ is the average value,
-
σ is the standard deviation.
When calculating the Z-score, we can use either a cumulative view of the entire historical data set or a shorter rolling window to better capture the dynamic nature of financial cycles and tapering peaks in MVRV.
Using the entire historical data for the MVRV Z-score conversion can lead to some distorted results, as earlier cycles with higher peaks distort the mean and standard deviation so that they do not reflect current market conditions.
Therefore, to account for these effects, we optimize the rolling window by shortening its length and using more recent market history as a benchmark.
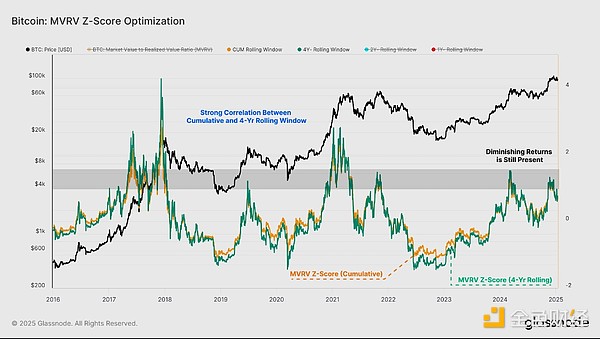
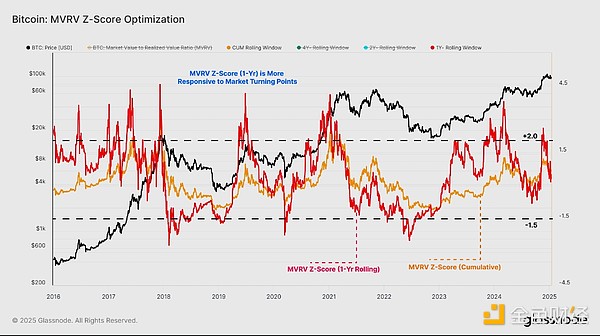
The chart below compares the cumulative Z-score to the version calculated using a 4-year rolling window. Despite our attempts to accommodate the dynamic nature of market cycles, the results remain almost the same and the MVRV peak decay issue remains unresolved.
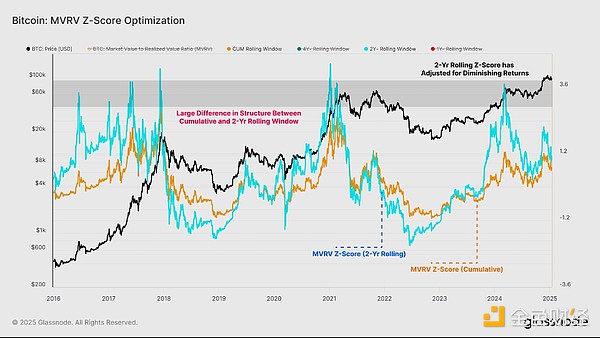
Moving to the 2-year rolling window for Z-score calculations (blue), the peak observed in the most recent cycle ATH in March 2024 is very close to the peak range of the previous two cycles.
In this case, we have now adjusted for a decrease in peak MVRV. However, the 2-year rolling window Z-score does not mark significant market highs in Q4 2015, Q3 2019, and Q2 2023, suggesting there may be potential for further optimization.
Finally, we applied a 1-year rolling window in the Z-score calculation, resulting in a more precise and promising transformation. This approach can identify mid- and late-stage peaks on a similar scale, providing a clearer representation of near-term market dynamics.
This 1-year MVRV Z-score suggests that cyclical bull markets continue to reach local and global peaks in the 2σ range, with investor profitability improving significantly over a relatively short period of time. During bear market phases, local and global lows are captured when MVRV trades -1.5σ away from the mean.
This improved MVRV Z-score can provide a more responsive framework for identifying key market turning points throughout the cycle and help adjust for overall peak declines near extreme values.
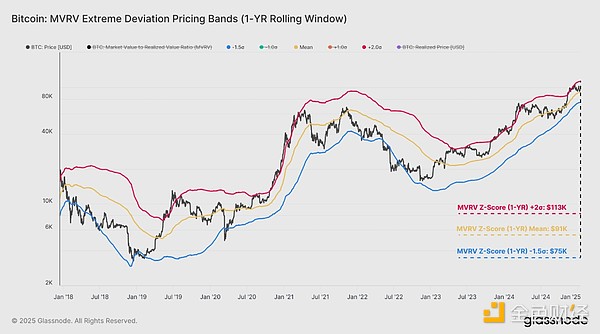
Now that we have optimized the rolling window to 1 year, we can extend this framework to work backwards to calculate the threshold price levels that define these recent peaks and troughs.
Bull markets are characterized by prices trading between 1-year averages, with peaks above around 2σ. Conversely, bear market prices remain below the average, with significant lows occurring around -1.5σ. This structured approach allows for a clearer delineation of market stages.
Currently, Bitcoin is trading at $94,398, which is above the 1-year average of $909,000 but below the +2σ threshold of $1.126 million. This suggests that the market is still in a bullish phase, although it has retreated slightly from its recent highs, when it was above the upper limit.
Assessment revision
The 1-Year MVRV Z-score model shows the market cooling off from a strong rally, and we can now assess investor profitability by measuring unrealized losses on holdings. This helps gauge the incentives of market participants and identify key risk areas that require attention.
First, by analyzing the entity-adjusted cost basis distribution of the circulating supply, it becomes clear that all unrealized losses are concentrated among short-term holders—investors who purchased tokens in the past 155 days (near the market peak).
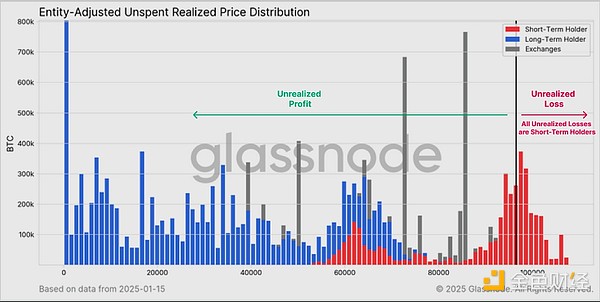
Focusing on the pressure on short-term holders as potential sellers, we can look for areas where unrealized losses could become severe if the current market decline intensifies.
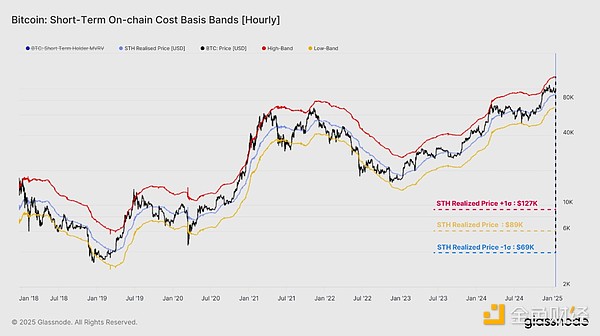
The average cost basis for short-term holders is currently $884,000. Based on similar statistical methods as above, we also show the high ($1.255K) and low ($685K) ranges that represent the typical extremes of price action during bull and bear markets.
Spot prices are currently 9.2% higher than short-term holders ' cost basis, indicating that the market is still in the normal state of a typical bull market. However, if the market fails to regain upward momentum, a fall below the STH cost basis becomes more likely, which could lead to short-term pressure and potentially additional selling if investors start to panic.
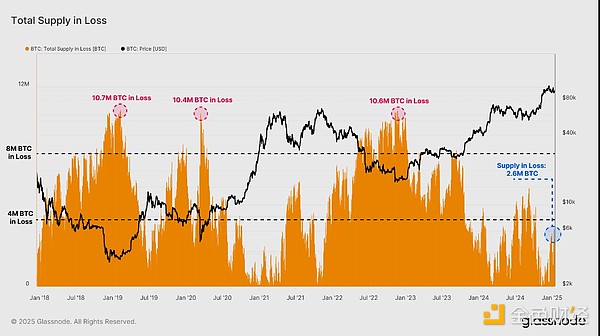
To better gauge the level of stress experienced, we can assess the BTC supply that is currently in a state of unrealized losses. From a historical perspective, over the past 10 years we can observe:
-
During bull markets, the number of BTC in losses typically remains below 4 million.
-
At the beginning of the bear market, the number of BTC losses reached 4 million to 8 million.
This week, market volatility resulted in the loss of 2 million to 3.5 million BTC. While the losses were significant, this range was still lower than the 4 million BTC losses during the local market lows between July and September 2024. This indicates that the current market may be in a more depressed state than the previous adjustment stage.
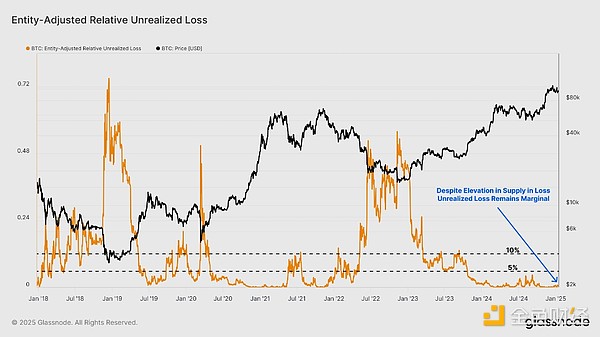
Another dimension of market pain is the relative unrealized losses metric, which measures unrealized losses (in U.S. dollars) relative to market capitalization. Looking back at recent cycles, we can see similarities between the current market and the 2016-17 bull market.
Unlike the 2019-22 cycle, where external shocks such as the COVID-19 pandemic pushed relative unrealized losses to levels above 10%, the consolidation phase in Q3 2024 only pushed this The indicator pushed up to about 4.3%.
It can be argued that the current market cycle is experiencing less stress, likely due to smaller drawdowns, lower volatility, and new spot demand via ETFs and institutional investors.
in conclusion
Bitcoin has entered a correction phase and is trading 11.1% below its all- time high of $108,000. However, spot prices are still trading above several key support levels, suggesting that the current bullish market structure remains intact. This is exacerbated by the relatively mild nature of market distress, as measured by historically small unrealized losses held by market participants.
We also show how MVRV z-scores optimized using a 1-year rolling window provide a framework for dealing with recent bullish and bearish market phases. According to this model, we remain within bullish territory, although the cost basis for short-term holders remains at $88,400, a key level to maintain constructive sentiment.


 panewslab