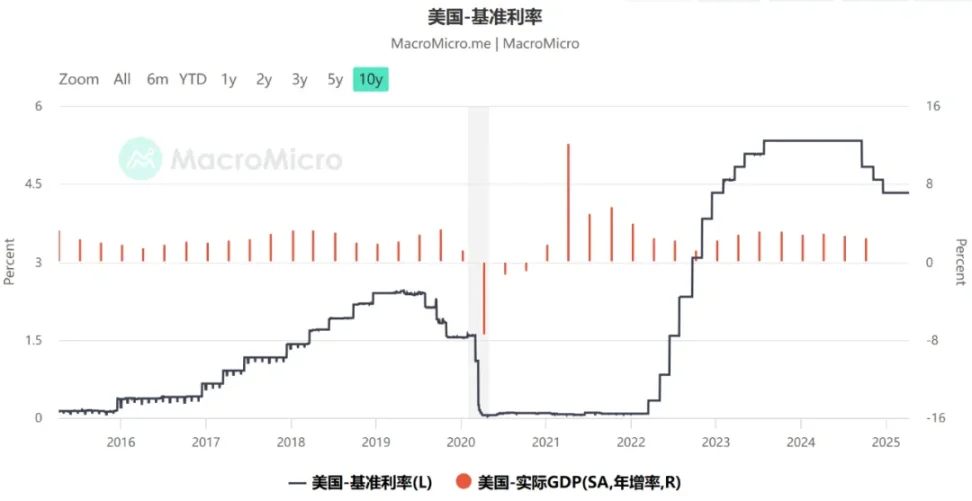
In addition to looking at the Fed, there is another important data on the future BTC market

Reprinted from panewslab
04/15/2025·11DAfter a week of ups and downs in tariff friction, the market finally had some respite on the weekend, but how long this respite can last is still undecided, because the tariff issue is an incidental emergencies, which leads to risk aversion of funds and a brief collapse of sentiment, so the volatility will be very large.
However, once the market confirms the fundamental changes brought by tariffs and the release of risk aversion, the entire financial market will find a new balance. This is why global stock markets, especially the US stock market, ended a week of volatility last Friday with a close increase. We can see this from the changes in the S&P 500 volatility index.
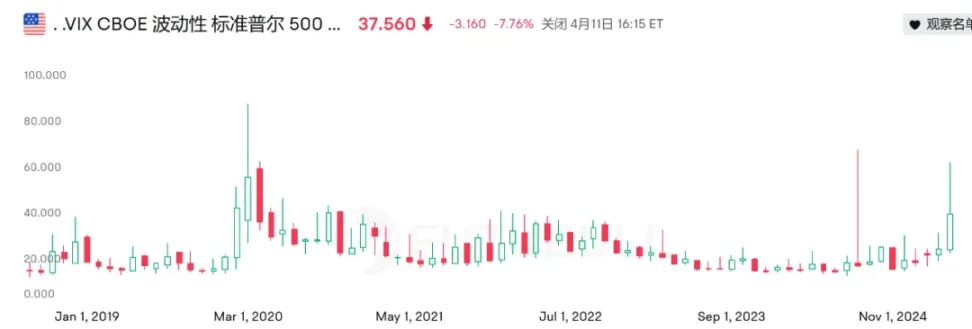
It can be seen that the VIX index hit a recent high last week. In the past few years, the ones that can be "compared" with the extreme incident of the Bank of Japan's interest rate hike last year were the financial turmoil caused by the epidemic in 2020. This is also the reason why the market has experienced such large fluctuations in the past week, after all, history is rare.
Then, when this huge fluctuation comes to an end, the Crypto market trend will return to the clichéd "inflation" and "rate cuts", because only interest rate cuts can usher in "water floods" and bring hope for growth to risky assets led by BTC.
By comparing the trends of global broad money supply (M2) and BTC over the past 10 years, we can analyze this correlation. The figure below can be seen intuitively that the huge increase in BTC in the past 10 years is based on the surge in global M2, and this correlation trend is far beyond other financial data.
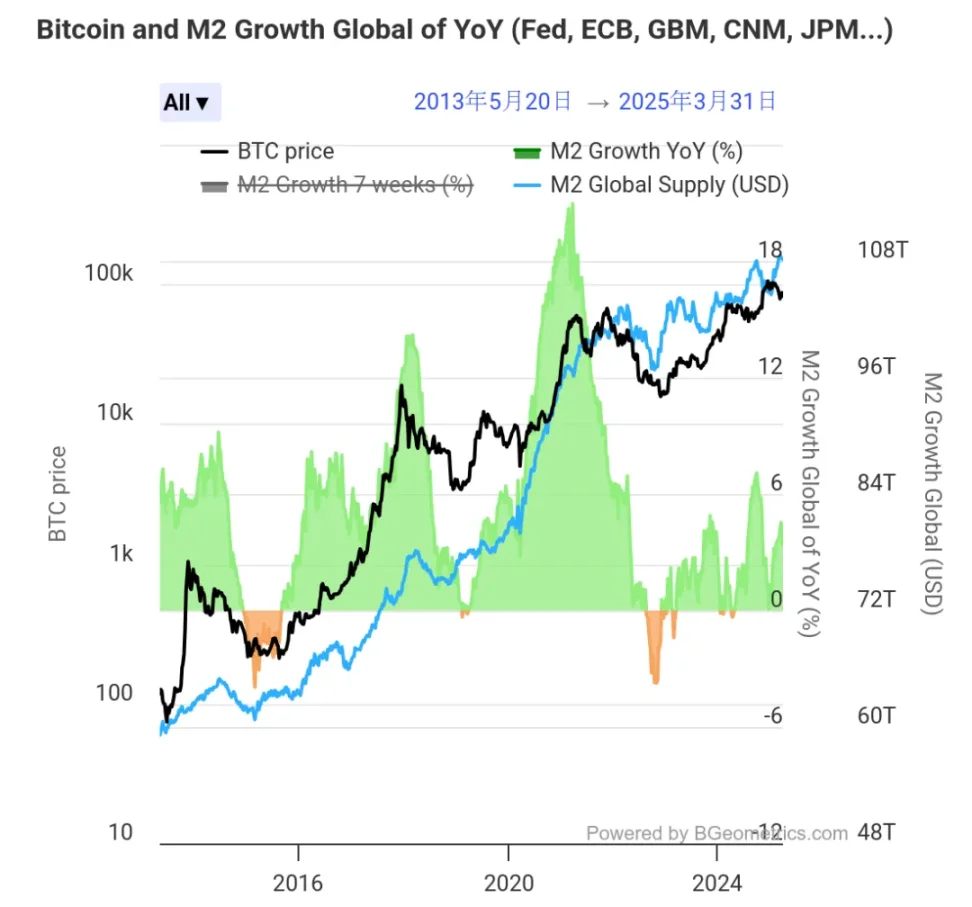
This is also why whenever the US wants to release data related to inflation or interest rate cuts, BTC always fluctuates because it ultimately affects whether new funds can enter the Crypto field.
But at present, most people in the Crypto market seem to only focus on the Fed's interest rate cut path, and ignore another data worth paying attention to - the scale of PBOC assets, that is, the scale of central bank assets, which reflects the current liquidity of my country's currency.
When everyone is paying attention to the financial market on the West Coast, we just ignore our own financial liquidity. In fact, it is also closely related to the rise and fall of BTC. After all, we are one of the best countries.
The figure below is a graph of the changes in the growth of BTC's past three cycles and the growth of PBOC's asset scale. It can be seen that this correlation fluctuation has almost run through every BTC's big rise, and it just corresponds to the cycle every 4 years.
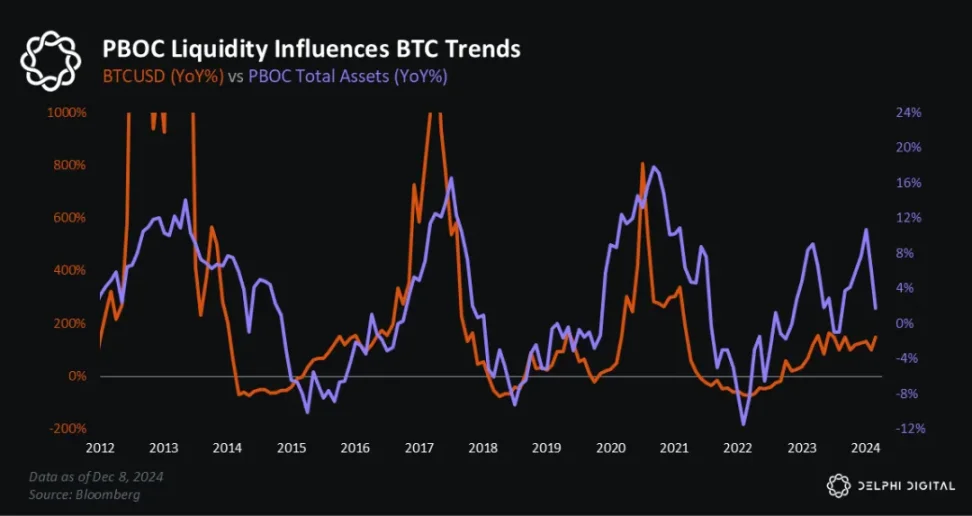
PBOC liquidity plays a role in the Crypto bull market in 2020-2021, the bear market in 2022, the recovery from cyclical lows from 2022-early 2023, the surge in the fourth quarter of 2023 (before the approval of the BTC ETF), and the pullback from the second to third quarter of 2024.
Also a few months before the 2024 US election, PBOC liquidity turned positive again, just bringing a wave of "election bulls".
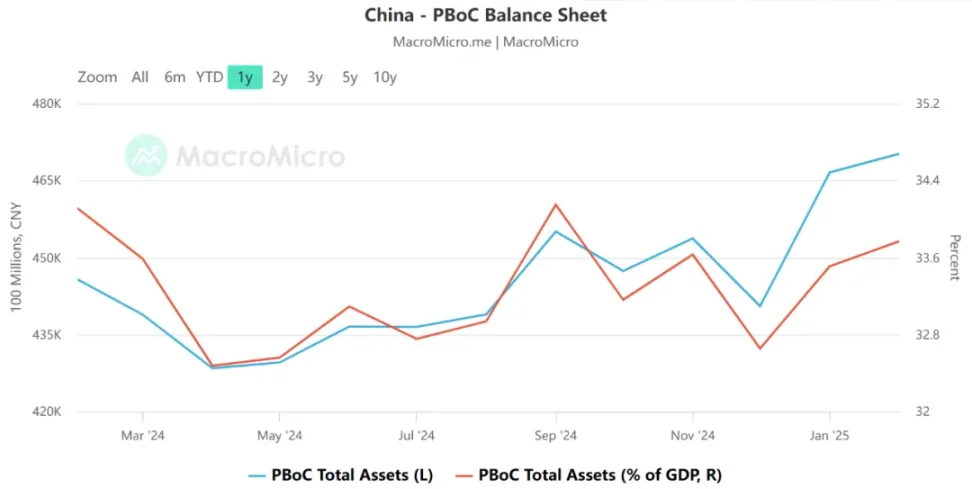
However, in the figure below, we can see that the scale of POBC began to decline after September 2024 and bottomed out at the end of 2024, and has now risen to the high of the past year. From the perspective of data correlation, changes in PBOC liquidity usually precede large fluctuations in the BTC and Crypto markets.
Interestingly, in the 2017 BTC bull market, the Fed was not the "water release" side. Instead, it raised interest rates three times throughout the year and there was a quantitative tightening. However, risky assets led by BTC were still very optimistic in 2017, because the size of PBOC hit a new high that year.
Even in terms of the increase in S&P 500, it is related to the liquidity of PBOC. Judging from historical data, the annual correlation coefficient between the total asset size of PBOC and the S&P 500 is about 0.32 (based on the 2015-2024 data).
Of course, in a sense, it is also because the PBOC quarterly monetary policy report overlaps with the time window of the Fed's interest rate meeting, so the correlation will be amplified in the short term.
In summary, we can find that in addition to paying close attention to the money-free situation in the United States, we also need to pay attention to changes in domestic financial data. A week ago, the news was released: "Monetary policy tools such as reserve requirement cuts and interest rate cuts have left enough room for adjustment and can be introduced at any time." What we need to do is to track this change.
It is worth noting that in terms of asset size, as of January 2025, the total deposits in my country were US$42.3 trillion, while the total deposits in the United States were approximately US$17.93 trillion. It has to be said that in terms of deposit size, we have more financial possibilities. If liquidity improves, some changes may occur.
Of course, another point that needs to be discussed is whether the liquidity of funds can flow into the crypto market if it has existed. After all, there are still some restrictions, but Hong Kong has given the answer. Judging from the tightness and convenience of the policy, it is different from a few years ago.
Finally, we will end this week's comment using Rebs' words, "Pigs will fly when the wind comes." It is better to ride on the momentum than sailing against the current. All we have to do is to dare to climb up the stairs and fly against the wind when the wind blows.
