Judging from the data, the changes in crypto companies: Coinbase's transaction revenue accounts for more than 50%, and USDC's weekly trading volume reached US$24 billion
Reprinted from chaincatcher
02/19/2025·2MAuthor: Kaiko
Compiled by: TechFlow
As North America quickly resolves tariff disputes, global markets gradually return to stability. Meanwhile, the United States is actively exploring the establishment of its own sovereign wealth fund, while David Sacks, a regulator in the cryptocurrency field, is optimistic that digital assets will usher in a "golden age."
This week, we will discuss in depth from the following aspects:
-
Coinbase's market performance before financial report release
-
USDC's transaction volume increases significantly on the Binance platform
-
Liquidity trend of counterfeit market
How encrypted data becomes a key tool for predicting financial
performance
Coinbase Financial Report Preview: Market Data Provides Early Insights
Coinbase will release its fourth quarter 2024 financial report this Thursday (February 13). Before this, by analyzing market data, we can obtain preliminary clues about their performance. Although analyst earnings expectations and outlooks can have a direct impact on stock prices, encrypted market data is often an important leading indicator of exchange health.
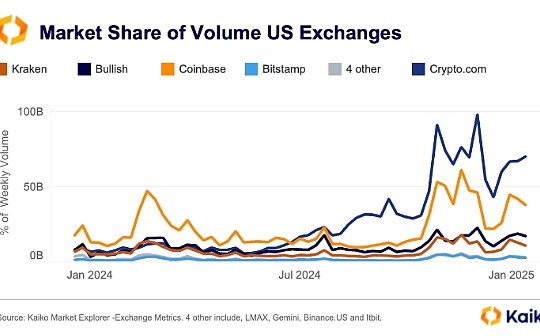
Data shows that Coinbase's weekly trading volume climbed to its highest level in two years. This trend shows that the platform has benefited greatly from the market rebound after the U.S. election.

In recent years, Coinbase's revenue sources have gradually diversified, and its "subscription and services" business (including pledge rewards, custody fees and USDC interest) has increased significantly in total revenue.
However, transaction revenue remains Coinbase's core business. Except for the quarter in 2023, transaction revenue always accounts for more than 50% of total revenue.
It should be noted that subscription and service revenue is closely related to the overall activity of the crypto market and does not play a role in diversifying risks. Therefore, subscription and service revenues can also be significantly affected in the event of sluggish trading activity or market prices.

For example, in the third quarter of 2024, Coinbase’s blockchain reward revenue fell 16% due to the decline in ETH and SOL prices.
Through Kaiko's blockchain monitoring tool, it can be seen that net traffic on the Ethereum beacon chain declined in the fourth quarter of 2024. As the second largest ETH staking entity behind Lido, Coinbase is one of the major contributors to this downward trend. Data shows that Coinbase's share in the pledge market has dropped by 3.8% over the past six months, with a net outflow of 1.29 million ETH during the same period.

This trend shows that although Coinbase still occupies an important position in the staking field, its market share is gradually being eroded by other competitors. This could adversely affect its long-term revenue growth and competitiveness.
Although the increase in ETH and SOL prices in the quarter has eased the impact of the reduction in staking to some extent, the overall data still shows that Coinbase's blockchain reward revenue may decline in the fourth quarter. Especially in the ETH staking market, Coinbase's market share fell by 3.8%, which had a direct impact on its staking-related income.
Coinbase’s commercial agreement with Circle enables it to obtain a stable source of revenue from USDC-related revenue. It is worth noting that Circle's new partnership with Binance and record USDC transaction volumes may have offset the impact of the decline in staking revenue to some extent. This provides an additional revenue buffer for Coinbase, especially when staking and transaction revenue is under pressure.
Retail traders, as users who pay the highest trading fees, have dropped significantly from 40% in 2021 to 18% of the current trading volume. Despite the growth of Coinbase’s subscription business such as blockchain rewards and custodial services, retail traders’ churn still put significant pressure on their trading revenue.

Since peaking in mid-2023, Coinbase’s “extraction rate” (i.e., the proportion of revenue earned from retail traders) has dropped to its lowest level since the Terra Luna collapse in the first half of 2022.
The decline in revenue comes as competition in the U.S. market is intensifying, with some platforms attracting users by significantly reducing transaction fees, further increasing pressure on platforms such as Coinbase.
Although Coinbase is still one of the most liquid exchanges in the United States and its fee structure (more beneficial to market makers rather than order eaters) is relatively stable, the decline in retail traders undoubtedly exacerbates the pressure on this source of income.

In addition, while Coinbase continues to enrich its product variety and gain more in cross-product synergy, its listing activity for its new assets has slowed significantly due to the strict regulatory environment in the United States.
The chart below shows that the number of active trading pairs on both platforms has seen a significant decline since the SEC filed a lawsuit against Binance.US and Coinbase in June 2023. However, if the regulatory environment improves in the future, Coinbase may re-accelerate its pace of listing, which may also enhance its appeal to retail traders.

Data points
USDC trading volume hits record high: Binance dominates
Binance is currently the world's largest USDC trading market, with weekly trading volumes reaching US$24 billion in January 2025, accounting for 49% of the total global USDC trading volume. This is the highest market share since September 2022. This significant increase was driven by Binance’s strategic partnership agreement with Circle at the end of 2024, which aims to drive wider adoption of USDC.
In contrast, Bybit's market share has dropped significantly, from 38% in October 2023 to the current 8%.

Meanwhile, the Bullish platform has risen rapidly, becoming one of Binance's main competitors with its 32% market share.
This change in the market structure is also reflected in the intensification of competition among stablecoins. Data shows that the proportion of newly listed USDT quoted pairs fell from 77% in 2023 to below 63% in 2024, while this proportion has further dropped to 50% so far in 2025.

It is worth noting that euro-backed trading pairs are gradually attracting market attention. This may indicate that the EU market is experiencing a recovery as the implementation of MiCA regulations in 2024. For a more detailed analysis of the euro market trends, please refer to our latest research report .
Copycat liquidity: the trend of centralization and the rise of small
tokens
Since the U.S. election, the market's prospects and sentiment for altcoins have improved significantly. This positive sentiment has driven a large number of new altcoin ETF applications, and has also driven a surge in trading activity.
Data shows that the daily altcoin liquidity indicator (measured by the 1% market depth of the top 50 Tokens) has nearly doubled since September 2023 to $960 million.

However, the liquidity distribution is not evenly distributed and is still highly concentrated among the top 10 copycats, and these tokens account for 64% of the total market depth. In contrast, the liquidity share of medium-cap Tokens (ranked 20–30) has decreased, while the small-cap Tokens (ranked 50) has shown surprising growth, with liquidity share even exceeding the higher-cap group. Not (ranked 40).

However, market liquidity is still highly concentrated, with the top 10 counterfeits accounting for 64% of the total market depth. In contrast, the market share of medium-cap tokens (ranked 20–30) has decreased, while the small-cap tokens (ranked 50) has unexpectedly achieved growth, with liquidity even surpassing the generation with higher market caps. Coin Group (Top 40).

 panewslab
 jinse
jinse