Taking tariff war as an example, interpret the relationship between panic index and risky asset trends

Reprinted from panewslab
04/15/2025·11DIn 2025, the tariff war escalated in full. The Trump administration announced that it would impose a minimum tariff of 10% on goods in almost all countries, and add higher tariffs to about 60 countries with the largest trade imbalance with the United States, causing panic in the global market. The main logic is
- Tariffs increase corporate costs and reduce profit expectations
- Disrupt global supply chains and deepen economic uncertainty
- Inspire retaliatory tariffs and expand risk of trade war
And in such an environment, capital market participants will:
- Reduce risk asset allocation (such as stocks, cryptocurrencies)
- Increase safe-haven asset allocation (such as gold, US dollar, Japanese yen)
- Increase volatility expectations → VIX soars
Tariffs → Rise of costs + Global supply chain disruption + risk of retaliation
- investment shrinkage + liquidity of safe-haven funds → Market panic
The Panic Index VIX also surged to 60 on April 7. What does this mean? There have been only three times in history, the last time occurred on August 5, 2024, and the first time was during the 2020 COVID-19 pandemic.
We can be sure that the current VIX index is in a historically extreme environment. Faced with such a situation, how can we predict the market through VIX?
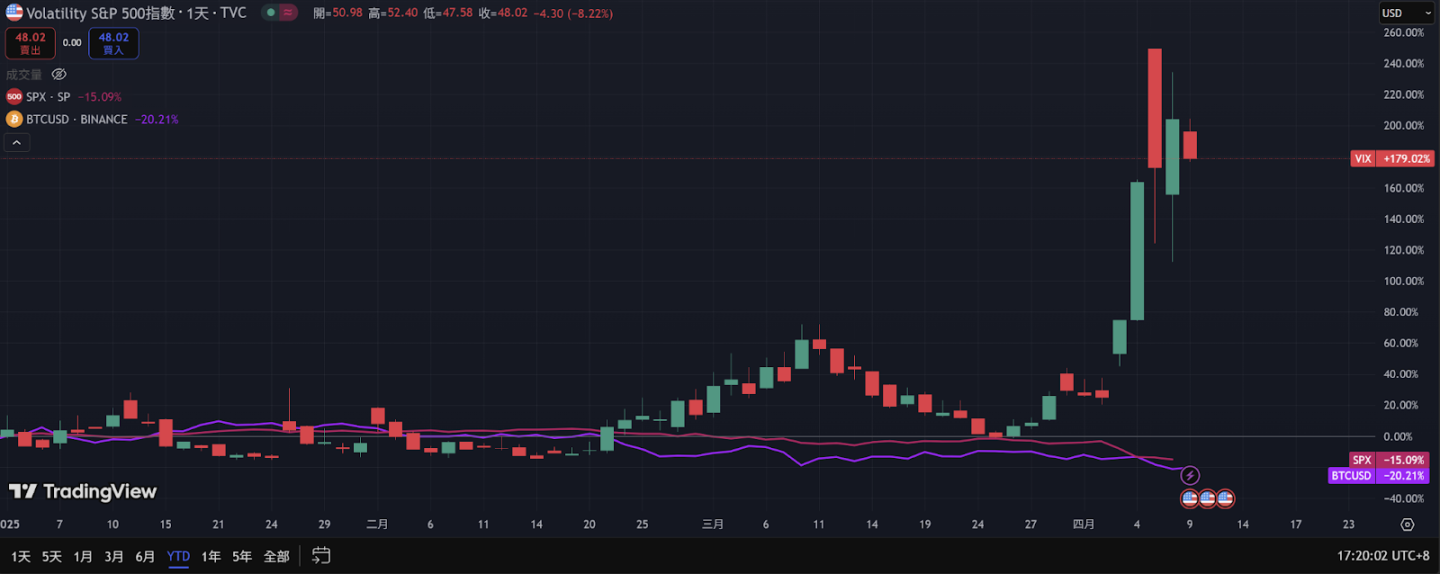
Reference: Tradingview
What is VIX?
VIX is a measure of market expectations for the next 30 days based on the S&P 500 option price, and is regarded as an indicator to measure market uncertainty and panic.
Simply put, the higher the VIX, the more intense the market expects to fluctuate in the future, and the stronger the panic; the lower the VIX, the calmer the market and higher confidence. Historical experience shows that VIX usually soars when the stock market falls sharply and falls when the stock market rises stabilise. Because of this opposite relationship to the stock market, VIX is also called the "panic index" or the market's sentiment thermometer.
The normal level of VIX is about 15–20 and is a calm range; when VIX is above 25, the market starts to panic; if it exceeds 35, it is extremely panic. In extreme crisis events (such as financial crisis or outbreak), the VIX index can even soar above 50, reflecting the market's extreme risk aversion. Therefore, by observing the changes in VIX, investors can understand the strength of the current market risk aversion sentiment as a reference for adjusting investment allocation.
High fluctuation panic interval: VIX ≥ 30
When the VIX index rises above 30, it usually means that the market is in a stage of high fear or panic. This situation is often accompanied by sharp declines in the stock market, but historical data show that the market often rebounds after extreme fear.
- Sample Events: There were about ten events in which VIX closed more than 30 for the first time between 2018 and 2024, and typical situations include the volatility storm in February 2018, the Christmas Eve sale in December 2018, the epidemic panic in February–March 2020, the retail storm in early 2021, and the interest rate hike and geopolitical shock in early 2022.
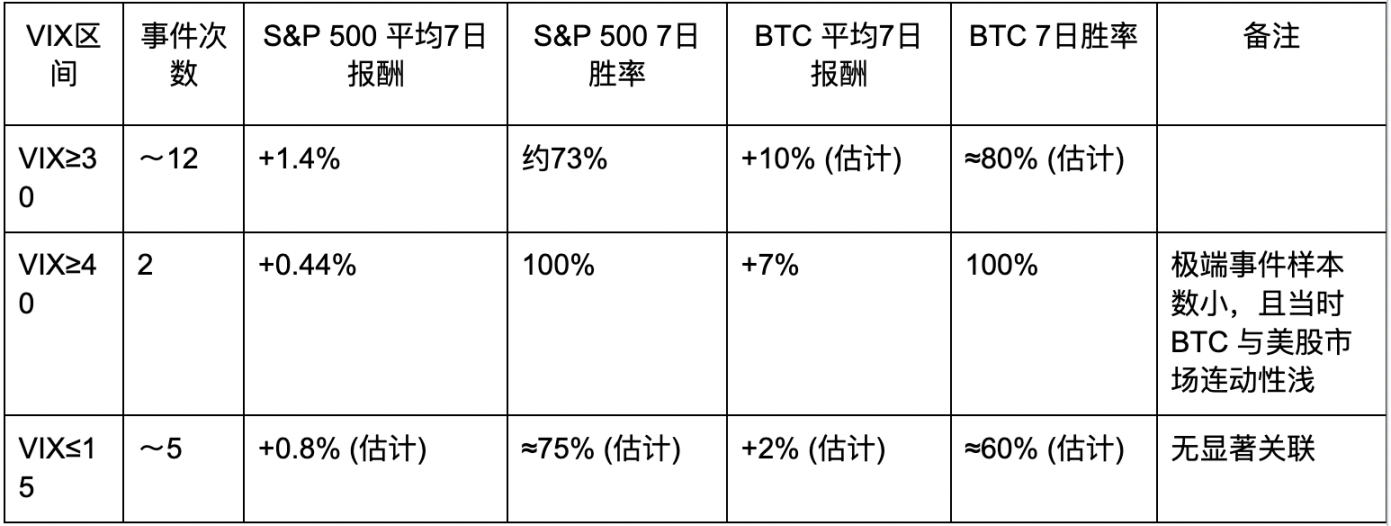
- S&P 500 Average Performance: S&P 500 tends to rebound positively within 7 days of these panic events. Statistics show that the average increase is about 1.4%, and there is about 73% chance that the event will rise after 7 days.
- This shows that when VIX soars above 30 (panic zone), most stock market situations will rebound technically in the short term.
BTC average performance: Bitcoin also tends to rebound strongly after extreme panic. Statistics estimate that BTC's average 7-day increase is about 10%, and its winning rate is about 75–80%. For example, when VIX rose above 30 due to geocrisis in February 2022, Bitcoin rose more than 20% in the following week, indicating that risk aversion sentiment similar to stock markets has subsided and rebounded
Extreme panic peak: VIX ≥ 40
When further raising the standard to VIX ≥ 40 (extremely panic), eligible events were extremely rare during the 2018-2024 period, and in fact only on February 5, 2018 and on February 28, 2020, the pandemic-induced plunge caused by the epidemic caused VIX to close above 40 (for the first time in four years), followed by VIX’s unprecedented 82 points in March.
Due to the small number of samples, the statistical results are only reference: after the 2020 incident, S&P 500 rebounded slightly by about 0.6% in 7 days (the market fluctuated violently that week but had a slight technical rebound), and BTC rebounded by about 7%. Both are 100% in terms of winning rate, but only due to the rise in a single event (it does not mean that the same situation guarantees an increase in the future). Overall, when VIX reaches a historical extreme value above 40, it often means that the market is extremely panic and selling pressure is close to the peak, and the chance of a short-term rebound is relatively high, which is relatively low in the big cycle.
- February 5, 2018 (VIX surged by more than 100% to nearly 50 intraday): S&P 500 rose only 0.28% in one week, without a significant increase. But Bitcoin plummeted 16% on the day and hit a local low of $6,900, and rebounded to more than $11,000 two weeks later, showing a significant rebound momentum. However, in the context of time and space at that time, the correlation between Bitcoin and real-world asset trends was not high, so it was not appropriate to use VIX to judge the trend of Bitcoin in this situation.
- Mid-March 2020 (VIX peak 82): After the S&P 500 bottomed out on March 23, it rebounded more than 10% in a week, and Bitcoin also quickly rose by about 30% from below $4,000.
Although the short-term performance after extreme panic is statistically positive, the sparse sample means high uncertainty, and the linkage between Bitcoin and US stocks at that time did not overlap very well like it is now. In practice, VIX over 40 is more about confirming the signal significance of the market in an extreme panic state, and the future market trend still needs to be analyzed in combination with fundamental information.
Low fluctuation range: VIX ≤ 15
When the VIX index drops below 15, it usually means that the market is in a relatively calm state. Investors are optimistic and have low risk aversion demand. But the subsequent trend at this time is not as clearly consistent as in the high VIX:
- Sample events: VIX fell below 15 several times between 2018 and 2024, such as after the strong rebound in the early 2019, the market stabilization period at the end of 2019, the mid-2021 stock market upward period and mid-2023, etc. During these periods, market volatility is at a historically low level (sometimes called market calm).
- S&P 500 Average Performance: Within 7 days after the VIX very low event point, the average return rate of the S&P 500 is about +0.8%, and the winning rate is about 60–75% (slightly higher than the random chance). Overall, stock indexes tend to maintain a slow rise or fluctuate slightly in a low volatility environment. For example, in the week after VIX fell below 15 in October 2019, the S&P 500 basically remained stable and hit a slight high; when VIX was around 13 in July 2023, the index continued to rise by about 2% in the next week. This suggests that low VIX does not necessarily lead to an immediate pullback and the market may continue to maintain an upward trend for a period of time. But it is important to be wary that extremely low volatility often implies market complacency. Once a sudden negative news occurs, volatility and decline may be significantly amplified.
- BTC average performance: Bitcoin’s trend during the VIX low-end period lacks clear direction. Statistics show that its 7-day average increase is only about +2%, and its winning rate is about 60%. Sometimes the calm period of low VIX coincides with BTC's own bull market (for example, in the spring of 2019, low VIX accompanied BTC's sharp rise); but sometimes BTC emerges from the pullback during low VIX (for example, when VIX remained low in early 2018, Bitcoin was in a bubble burst downward trend).
Therefore, the low VIX's reference value for the subsequent trend of BTC is not obvious, and it must be combined with the capital sentiment and cyclical considerations of the crypto market itself.
Overall, when the VIX is below 15, the S&P 500 often continues the existing trend (in most cases it is a slow rise), but the increase and winning rate are significantly lower than the rebound after panic. However, BTC lacks a unified response model in this environment, indicating that low traditional market volatility does not necessarily mean crypto market synchronization.
Conclusion: Risk and opportunity coexist, carving a boat and seeking a
sword is only for reference
When VIX soars to the 30–40 range
- Short-term risks may be present, but it also contains potential reversal opportunities.
- BTC usually falls simultaneously in panic selling pressure, but as panic slows down, the shorts accumulated by excessive selling are prone to trigger a strong technical rebound.
- If you observe that VIX begins to peak and fall (slowly return from 35 to below 30), it is a potential opportunity to buy BTC in the short term.
- The severity of the incident itself must be examined at the same time. If major financial risks break out, the market may continue to fall deeply in the future.
When VIX ≥ 40
- This means that the market is in extreme panic, including the possibility of liquidity exhaustion and large withdrawal of funds.
- The probability of a short-term sharp drop in BTC is extremely high, but often if the panic is slightly relieved after one or two weeks, it is expected that the rebound of BTC will be relatively astonishing.
- This environment recommends that short-term speculators maintain high risk control and strictly observe stop loss, because while "lipping blood from the knife" is the same, profit and risk coexist.
- All are relatively low in terms of the large cycle
When VIX ≤ 15
- The market is generally in a natural state. Whether BTC rises often depends more on the crypto market's own cycle, capital market or technical trends.
- In an overly calm environment, be careful that once a sudden variable or black swan event occurs, VIX jumps rapidly, and BTC may also fall as a result.
- You can consider retaining a portion of cash/stable coins as a preparation during this period and pay attention to the risk trend at any time.
Intermediate area of VIX 15–30
- It is generally considered a "normal fluctuation" range. BTC will also be affected by the encryption cycle and macro-pocket market. At this time, VIX can be used as an auxiliary indicator.
- If VIX rises from above 20 to near 30, it means that panic is gradually rising and risks need to be moderately prevented; on the contrary, if VIX slowly falls from 25 to below 20, it means that panic fades and BTC may be relatively stable.
Writing: VIX is currently at 50. Faced with the uncertainty of US tariffs, market sentiment is still in extreme panic, but the market is always born in despair.
During the 2020 epidemic, the VIX exceeded 80. At that time, the S&P 500 was about 2300 points. Even after panic, the S&P 500 was still around 5000 points, and it still exceeded 100% ROI in five years. At the same time, Bitcoin was at an excellent buying point, which was only US$4,800, and the high point of this bull market fell at US$110,000, with a maximum increase of nearly 25 times.
Every sharp drop is often accompanied by market repricing and capital flows. Chaos is the ladder, and whether it can climb and leap is the key issue in this period.
